|
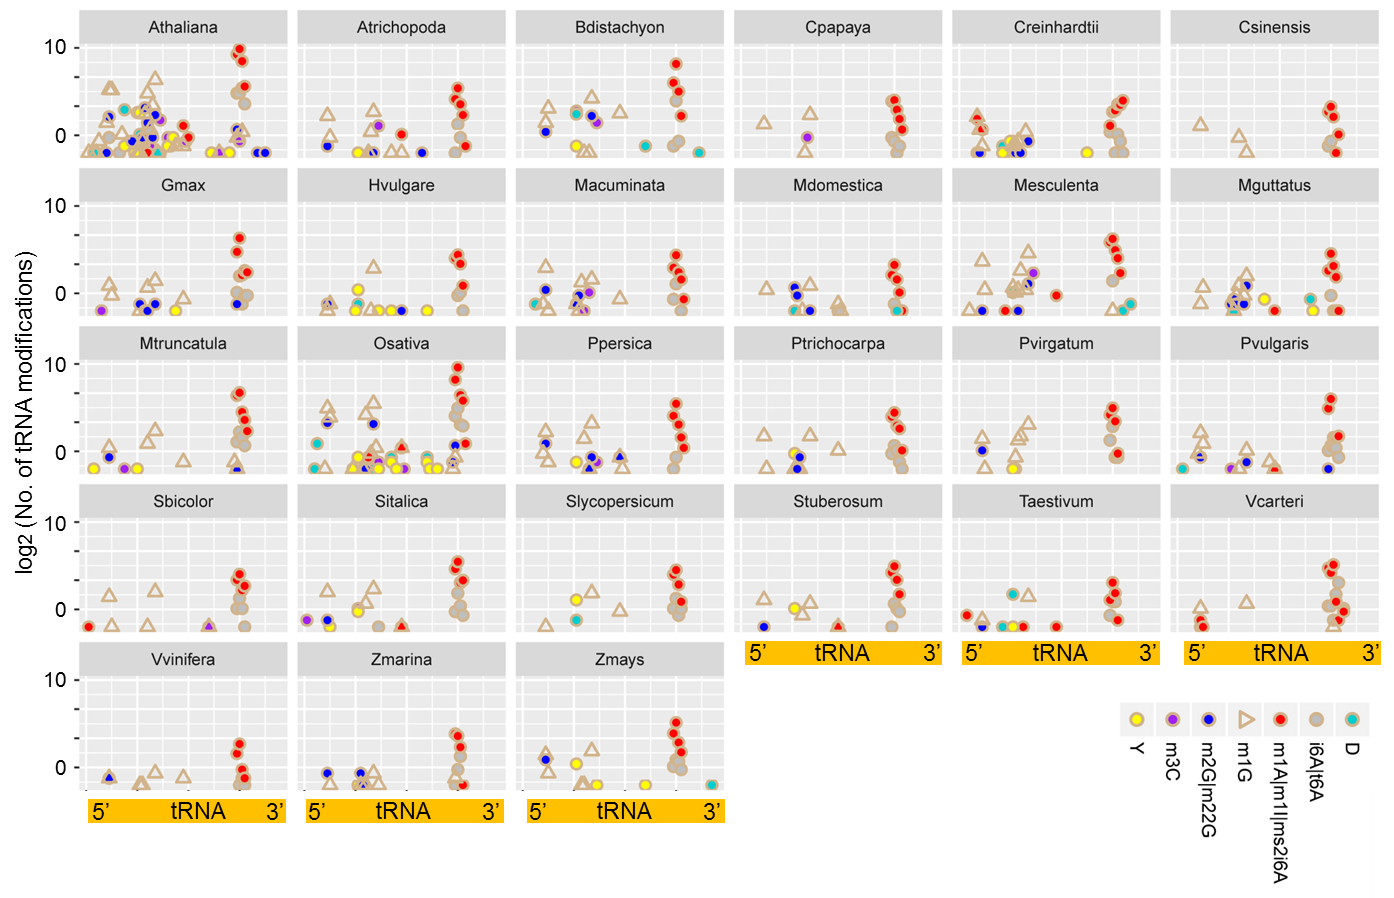
In our initial analysis, 2409 RNA-seq and 55 degradome-seq data were downloaded from NCBI SRA and NCBI GEO databases. 215 sRNA-seq data were downloaded from Plant MPSS database or from Donald Danforth Plant Science Center. By using a self-developed pipeline and adopting the strict criteria, we were able to identify RNA modifications among 927 RNA-seq, 31 degradome and 211 sRNA-seq datasets. Specifically, a total of 3993 tRNA modification sites from 27 species and 5790 mRNA modification sites from 33 species were curated in PRMdb. The following pie graphs show the proportion of different modifications in different species. The last scatter plot illustrates the distribution and frequency of different modifications along mature tRNA in different species.
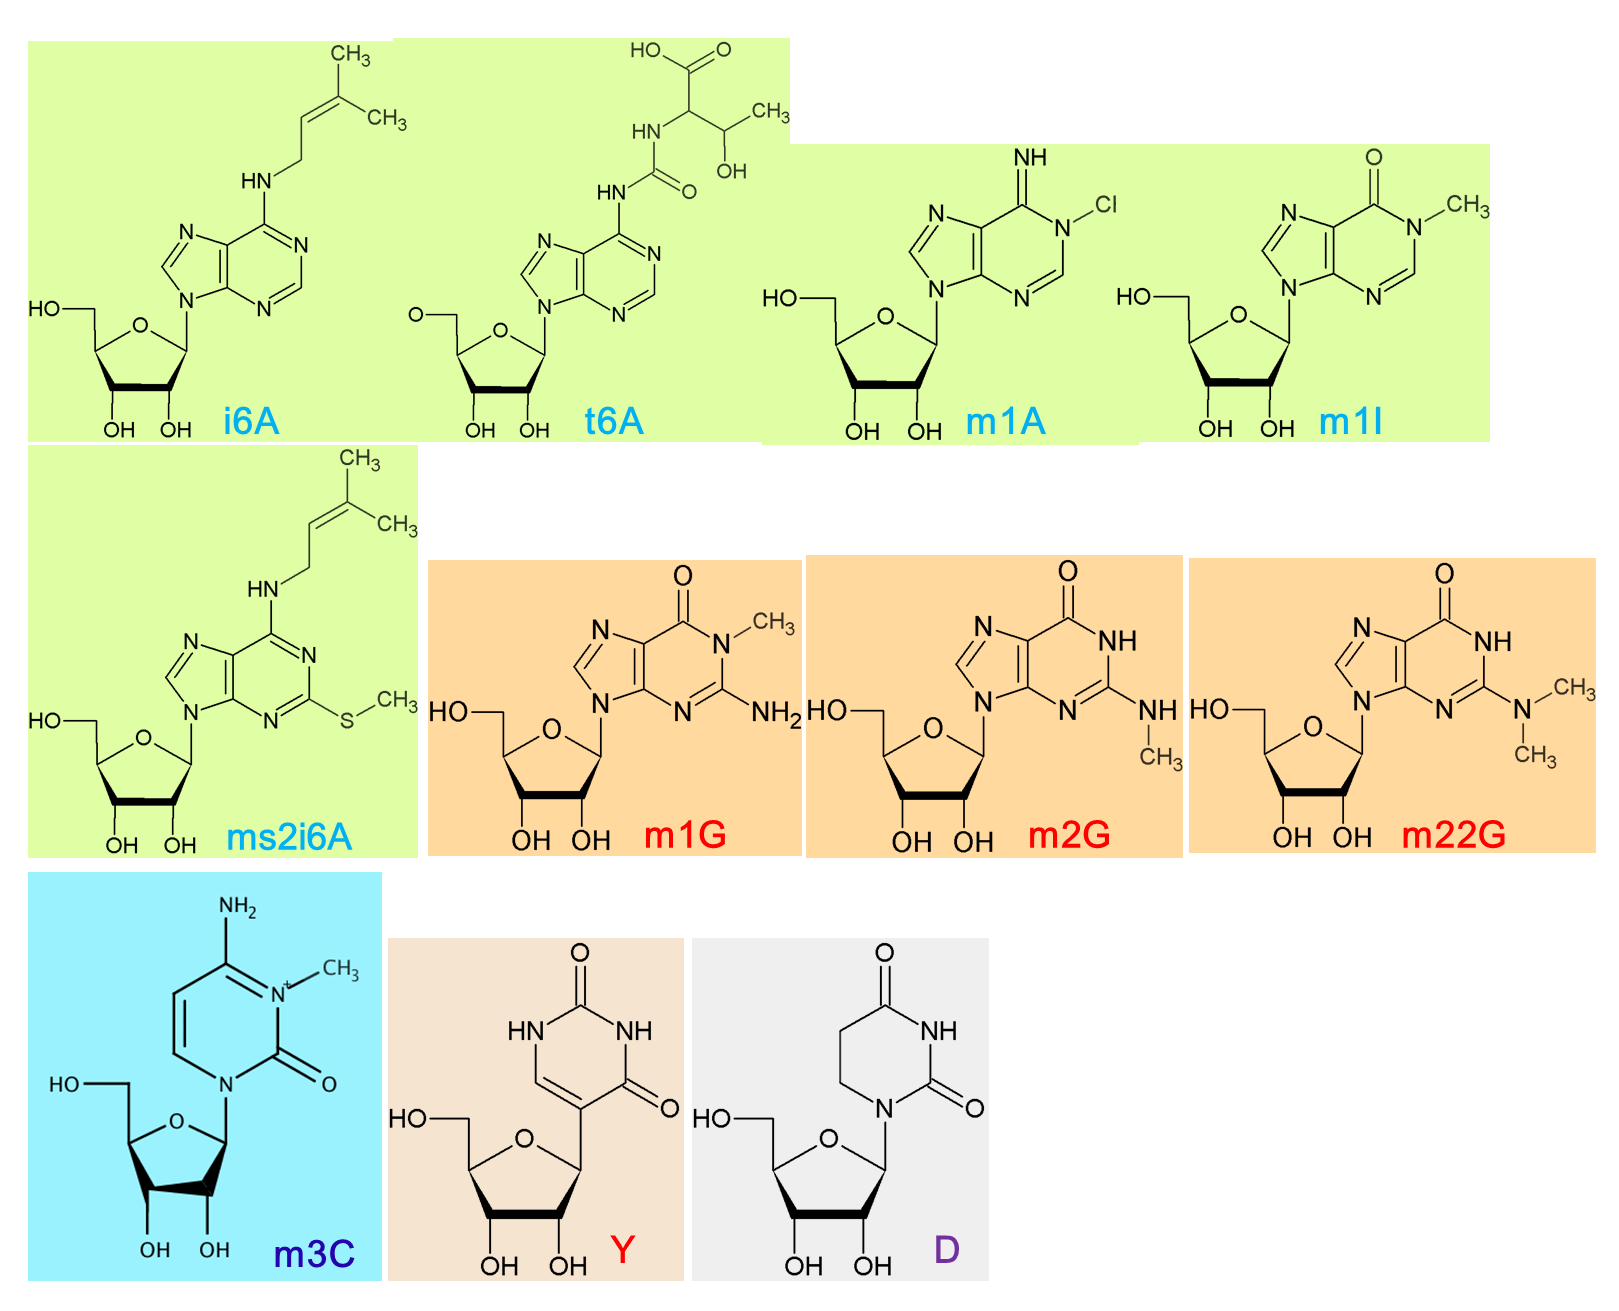
Click here for Structural Views of Modified Bases |
log2 of Numbers of tRNA Modifications in Different Species
log2 of Numbers of mRNA Modifications in Different Species
![]()
Distribution of modifications along tRNA
|
|
Copyright @ 2019, Webmaster: Xuan Ma
College of Life Sciences,Tianjin Normal University,Tianjin, 300387, China