![]()
![]()
![]()
![]()
![]()
![]()
![]()
![]()
|
The sequencing data used to create PRMdb are derived from NCBI, Plant MPSS db or sRNA data at Danforth Center. A full list of data accession numbers can be found here. Plant genomic sequences and annotations were downloaded from Phytozome. Our workflow of creating PRMdb consists of three sections, and the major commands in our analysis are presented below. A guide of PRMdb website is also shown below.
Analysis Procedure Section I - Identification of RNA modifications by RNA-seq (1) The raw mRNA-seq data dowloaded from NCBI SRA is firstly converted to FASTQ format using fastq-dump. fastq-dump --gzip --skip-technical --readids --dumpbase --split-files --clip IN.sra (2) Then, the reads with low-quality ends are trimmed using Sickle (below is for PE data). sickle pe -t sanger -g -f R1.fq.gz -r R2.fq.gz -o OUT1.fq.gz -p OUT2.fq.gz -s OUT_singles.fq.gz -n (3) Next, we subsample FASTQ files and perform genomic mapping. The BAM file is used to determine whether the RNA-seq is strand-specific or unstranded using RSeQC. infer_experiment.py -i IN.bam -r REF.bed (4) Genomic mapping is performed using HISAT2 (below is for SE data, dUTP method), and only uniquely mapping reads are retained. hisat2 --dta --no-unal -p 2 --rna-strandness R --known-splicesite-infile IN.ss -x Index -U IN.fq.gz | perl -ne 'print if /^\@/; print if /NH:i:1\s/' | samtools view -Sbo OUT.unsorted.bam - (5) Stranded RNA-seq alignments were assembled using StringTie (the following example shows dUTP method for library construction), and the transcripts (with length >100-bp and FPKM>1) not overlapped with annotated transcripts were assigned as un-annotated transcripts. stringtie IN.bam --rf -m 100 -G IN.gff -o OUT.gtf (6) The BAM files are sorted and indexed. Reference genomes are also indexed. (7) RNA modification sites are identified using HAMR. python hamr.py --paired_ends IN.bam REF.fa models/euk_trna_mods.Rdata OUT ath 30 10 0.05 H4 0.01 0.05 0.05
Section II - Identification of tRNA modifications by sRNA-seq (1) tRNA loci are identified by tRNAscan-SE. tRNAscan-SE IN.fa -o OUT (2) tRNA loci are identified with a minimum score of 60. Duplicated tRNA sequences are collapsed and a -CCA tail is appended to the 3' end of each tRNA. (3) sRNA-seq data is mapped to candidate tRNAs using bowtie with a maximum of two mistaches (for multimappers, choose the best alignment). bowtie -f -v 2 -k 1 --best -S Index IN.fa (4) HAMR is used to identify RNA modifications. python hamr.py IN.bam REF.fa models/euk_trna_mods.Rdata OUT ath 30 10 0.05 H4 0.01 0.05 0.05
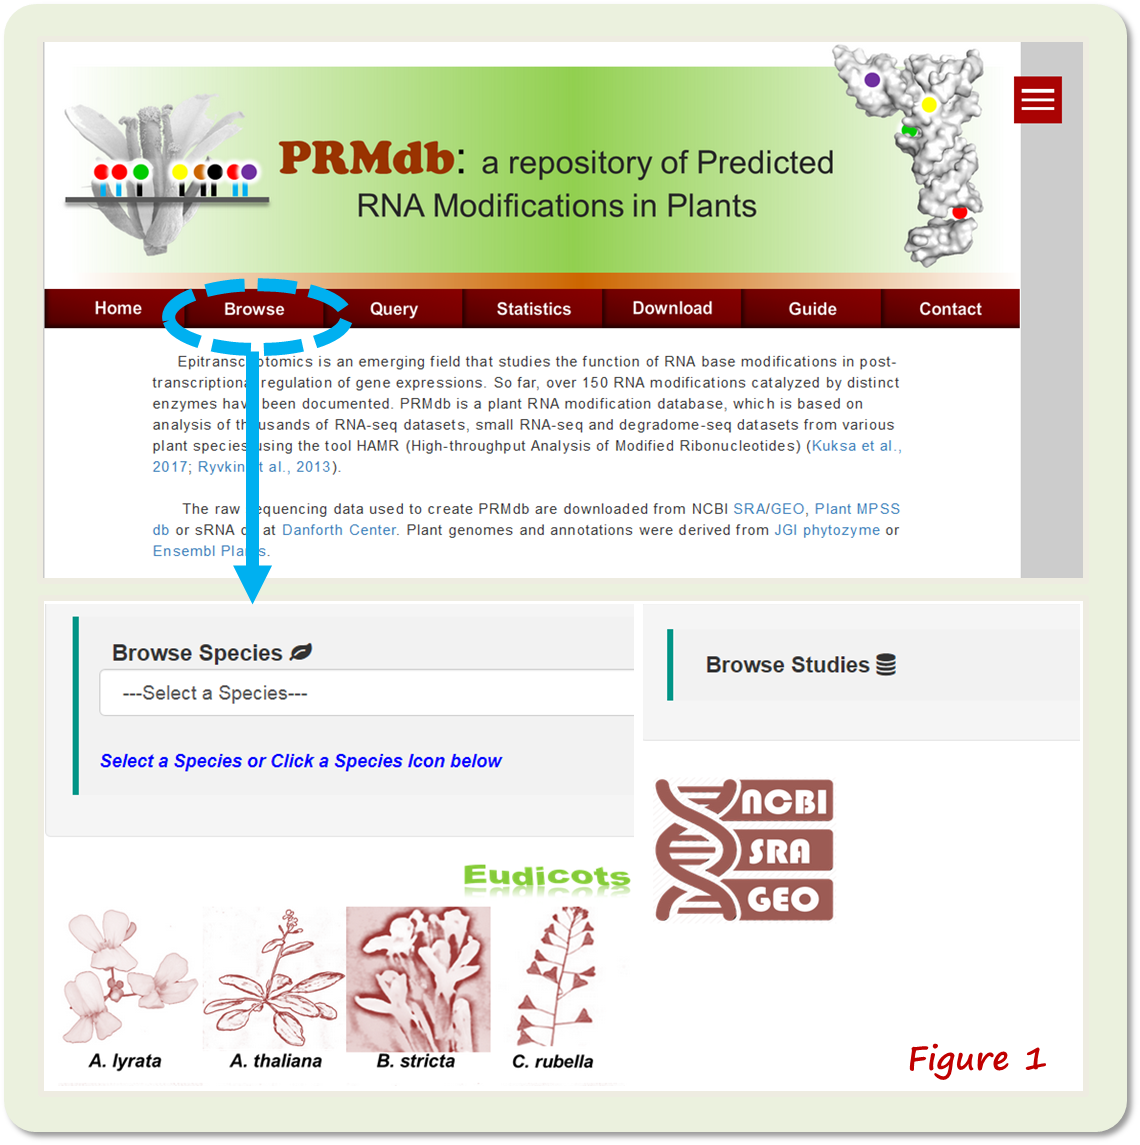
Website Guide The 'Home' webpage provides an introduction and an overview of the methodology for constructing PRMdb. The 'Browse' webpage contains species snapshots or dropdown menu that links to RNA modification data (Figure 1).
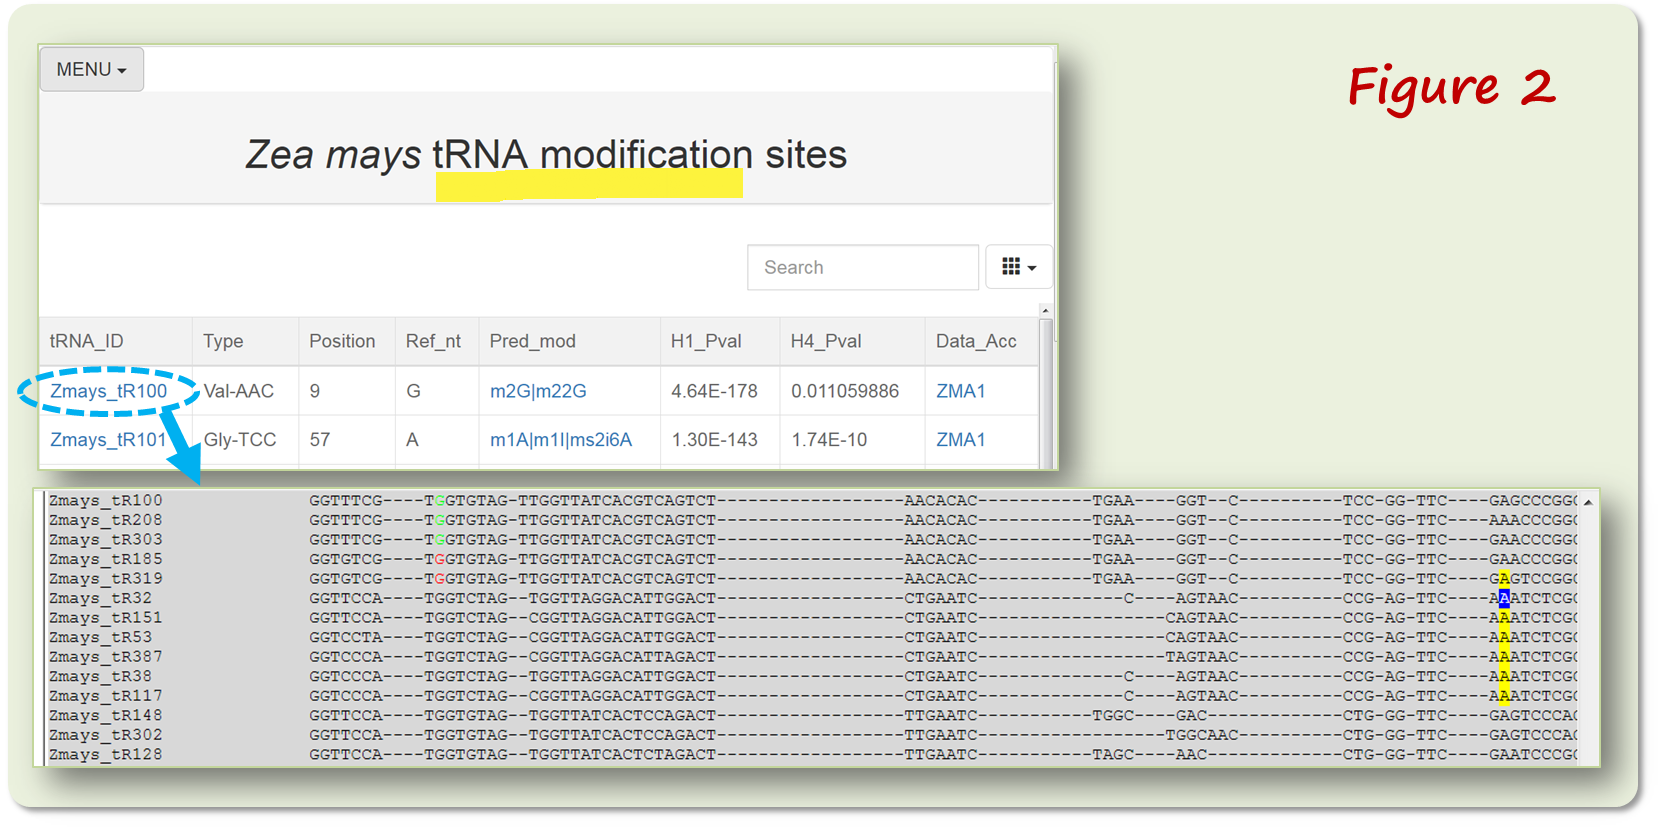
PRMdb collects RNA modification data from 38 species including 21 dicots and 11 monocots, one basal angiosperm species and five algae species. The tRNA data contains sequence alignment to facilitate users easily visualize the tRNA modification sites (Figure 2).
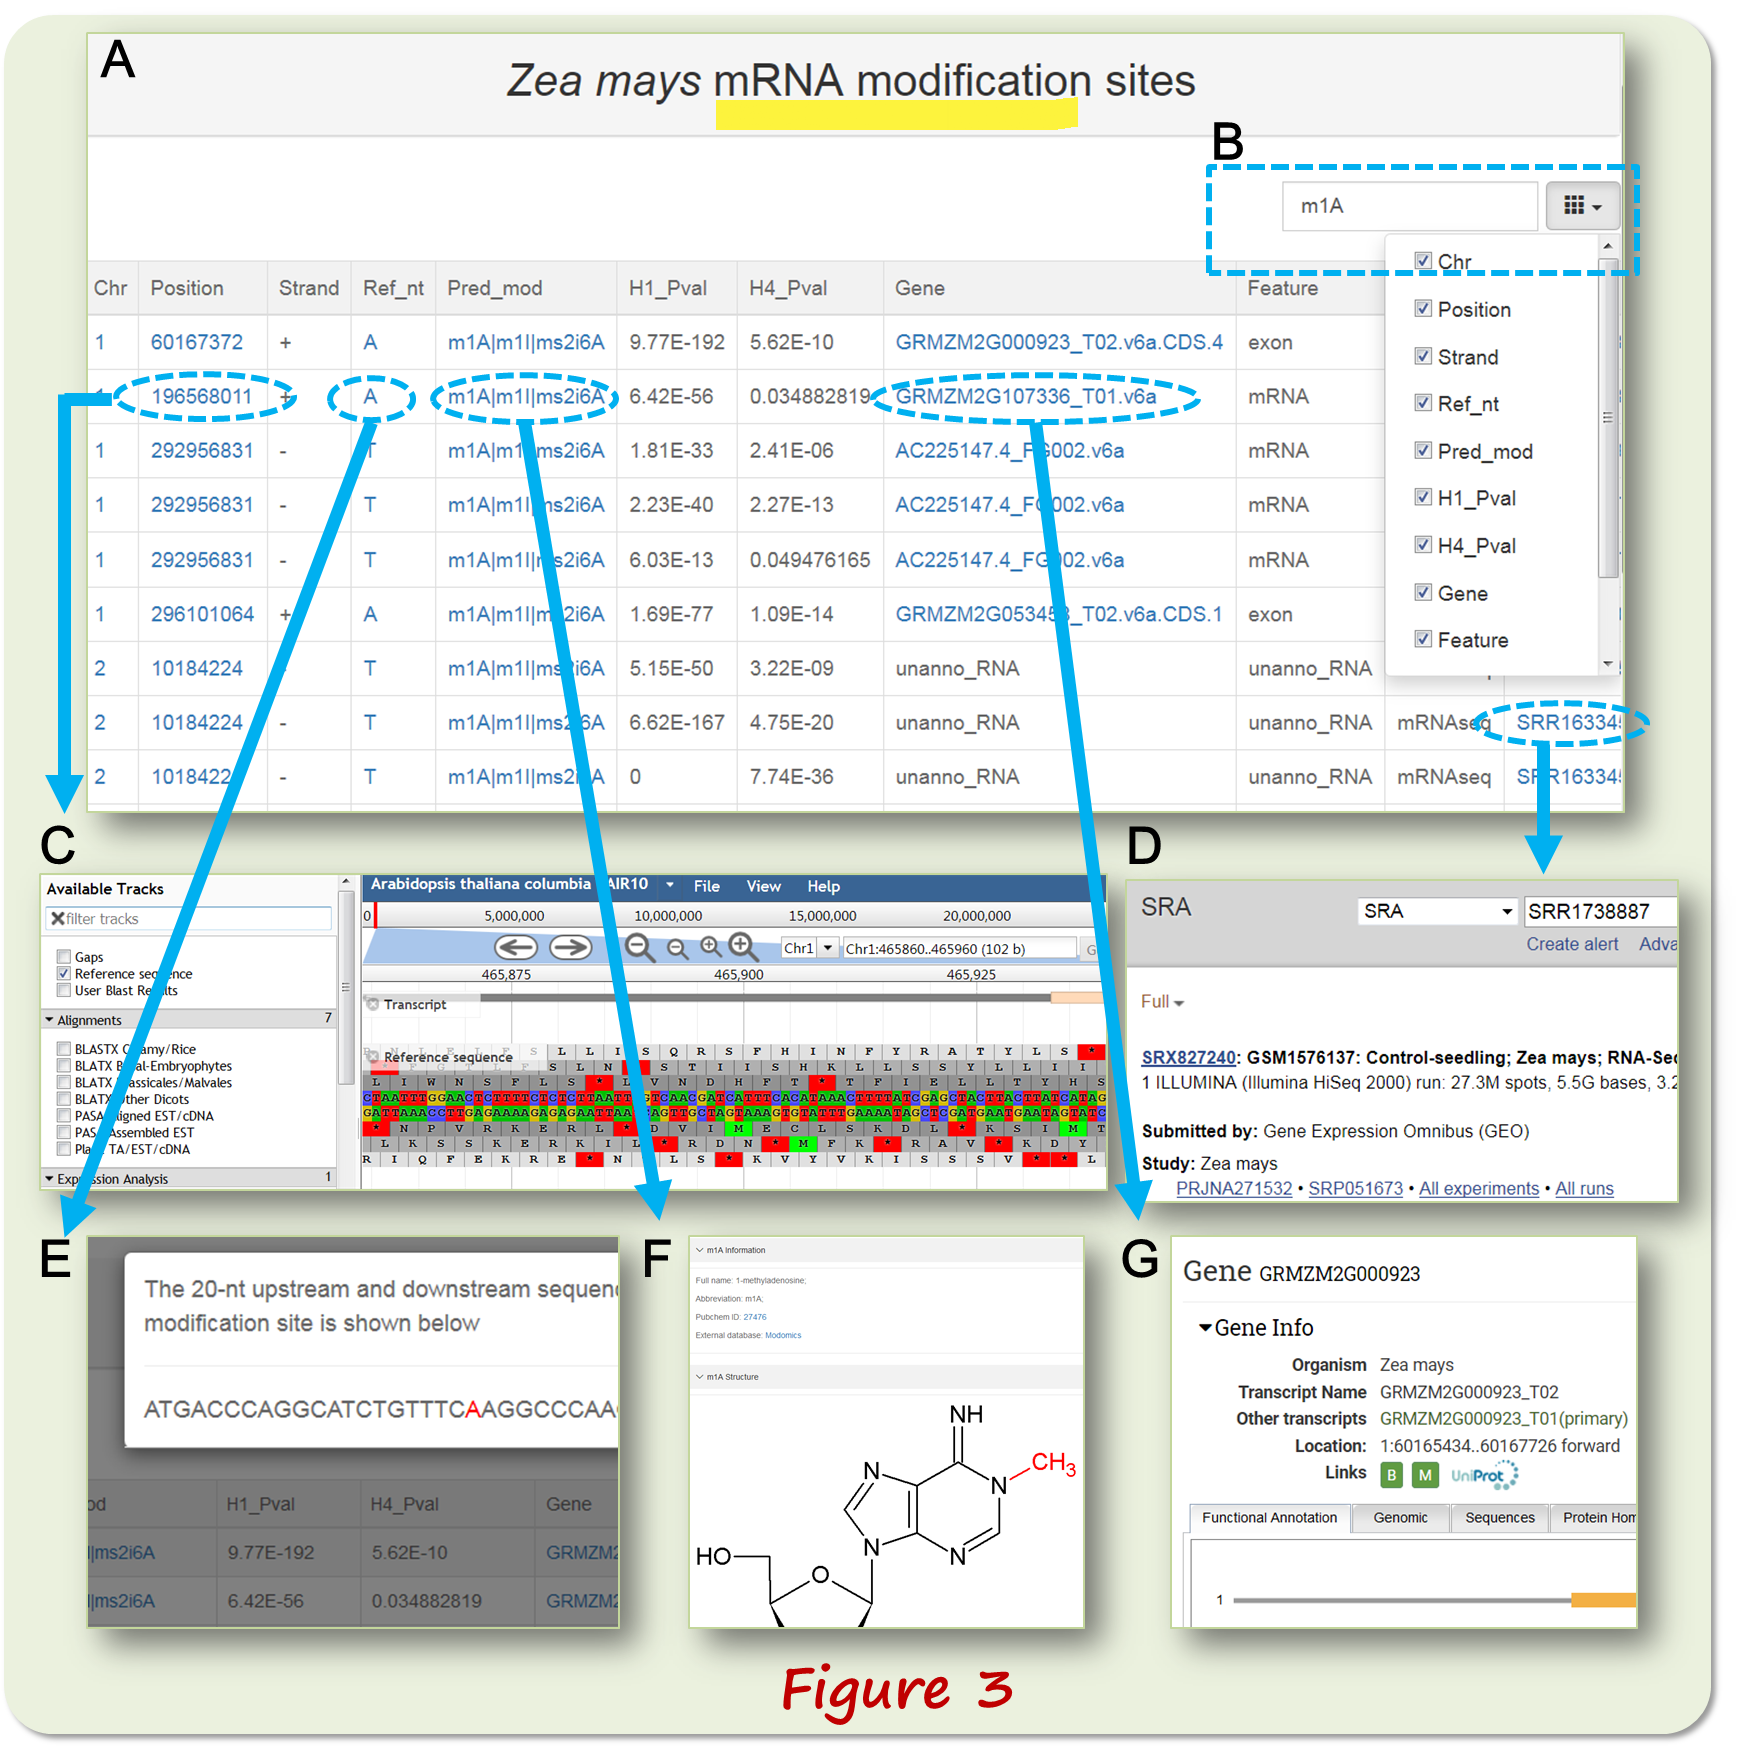
The mRNA modification data webpage (Figure 3A) allow the users to filter the results by keywords (Figure 3B) and have hyperlinks to Genome Browser for visualizing the modification site in genomic context (Figure 3C). The accession numbers of raw data are linked to the corresponding NCBI databases (Figure 3D). The 20-nt upstream and downstream sequence around the modification site can also be viewed (Figure 3E). The chemical structure of the modified nucleotide can be viewed (Figure 3F). The gene ID is linked to external Phytozome database (Figure 3G).
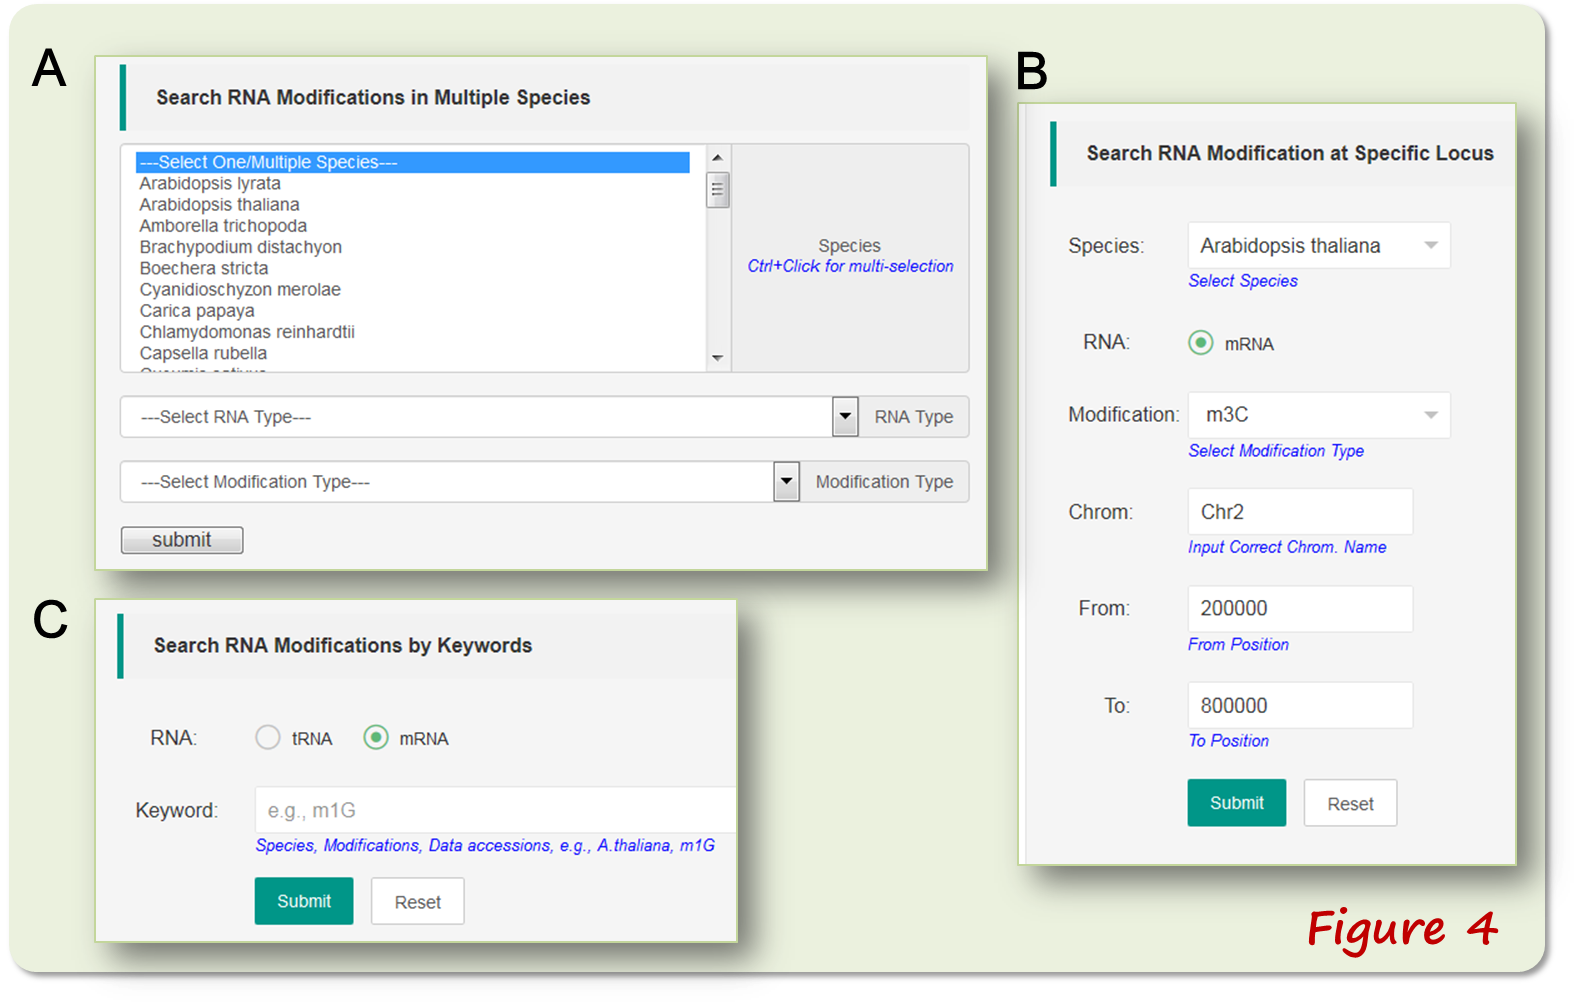
The 'Query' webpage employs three ways in modification data mining: (i) searching the modification sites from multiple species; (ii) searching the modifications from a genomic locus of a species; (iii) searching the modifications by keywords. (Figure 4).
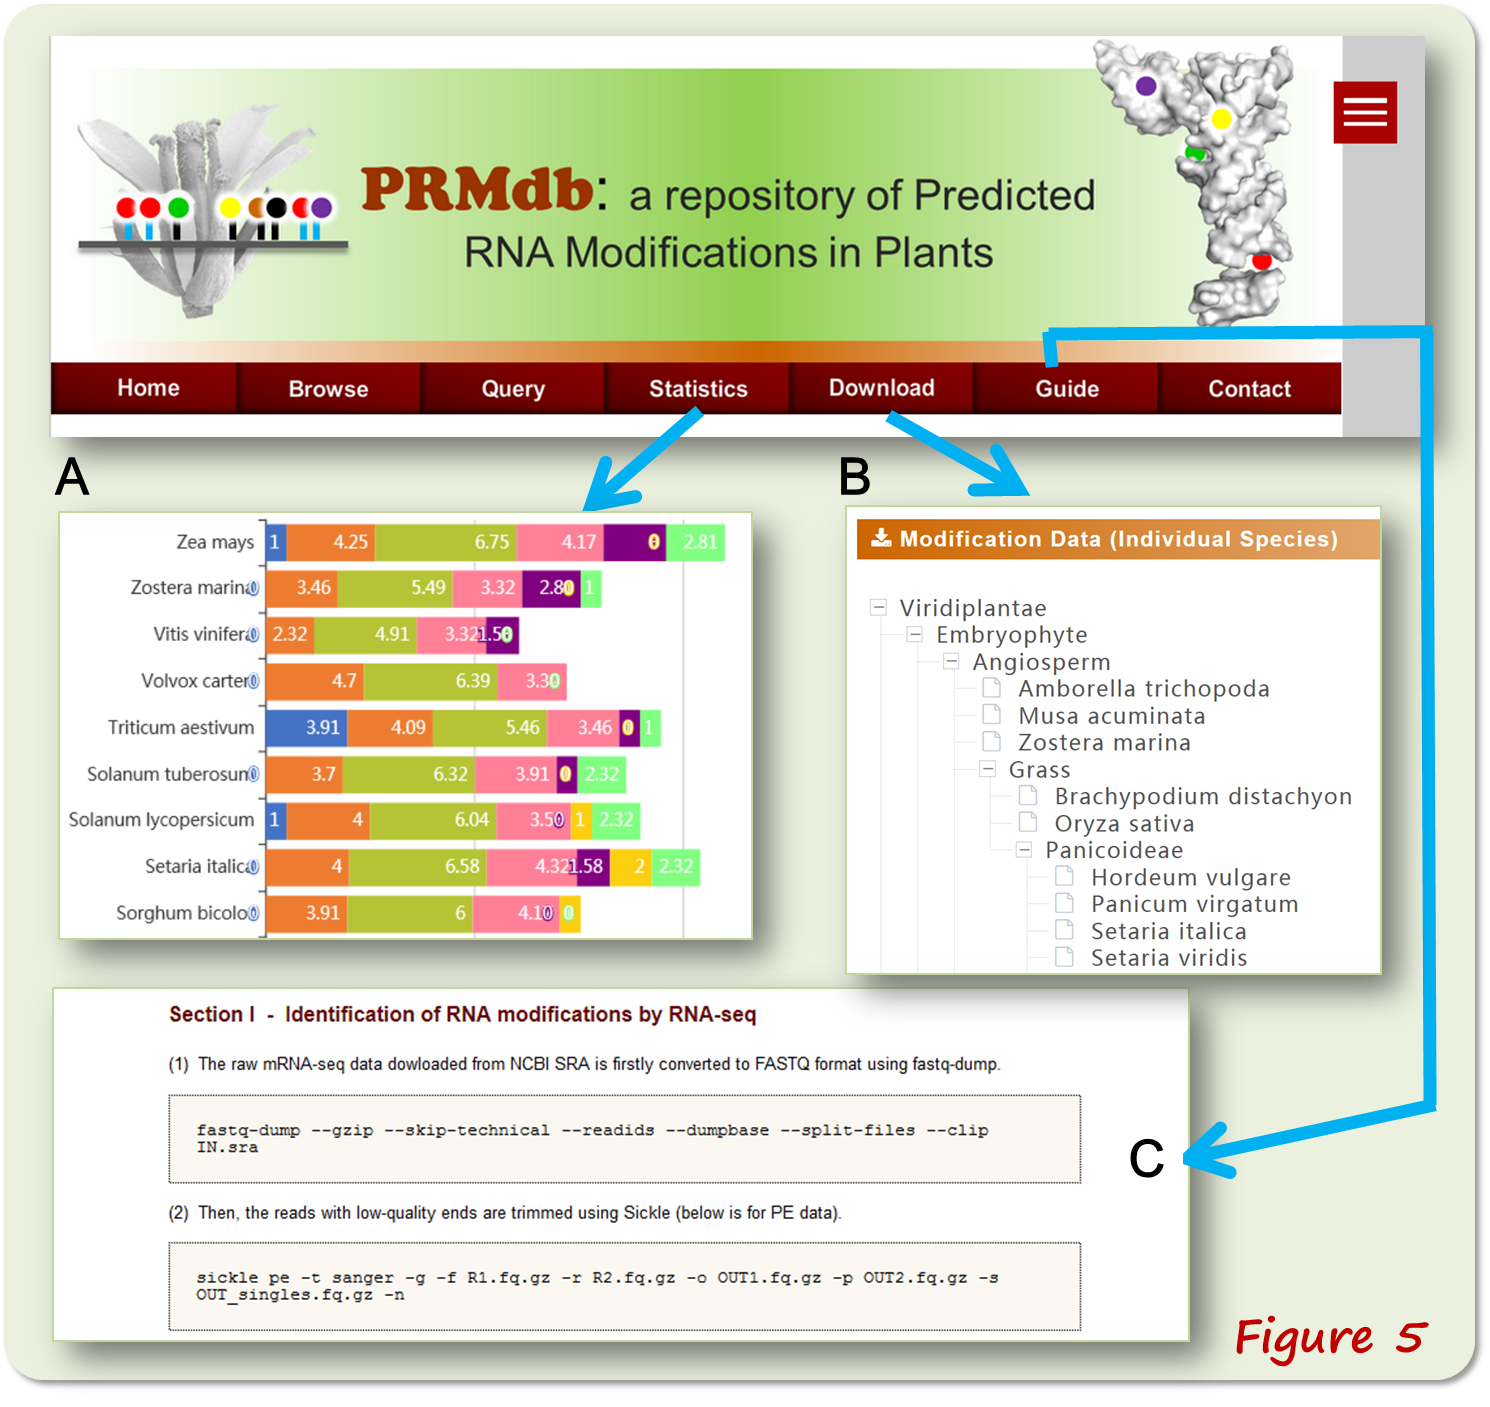
The 'Statistics' interface presents graphic summaries of identified RNA modifications in various species (Figure 5A). The 'Download' webpage stores tRNA and mRNA modification data, as well as the predicted tRNA sequences and a list of accession numbers of sequencing datasets (Figure 5B). The 'Guidance' interface shows our step-to-step protocol including the main commands for identifying RNA modification sites (Figure 5C).
Copyright @ 2019, Webmaster: Xuan Ma |